折线图
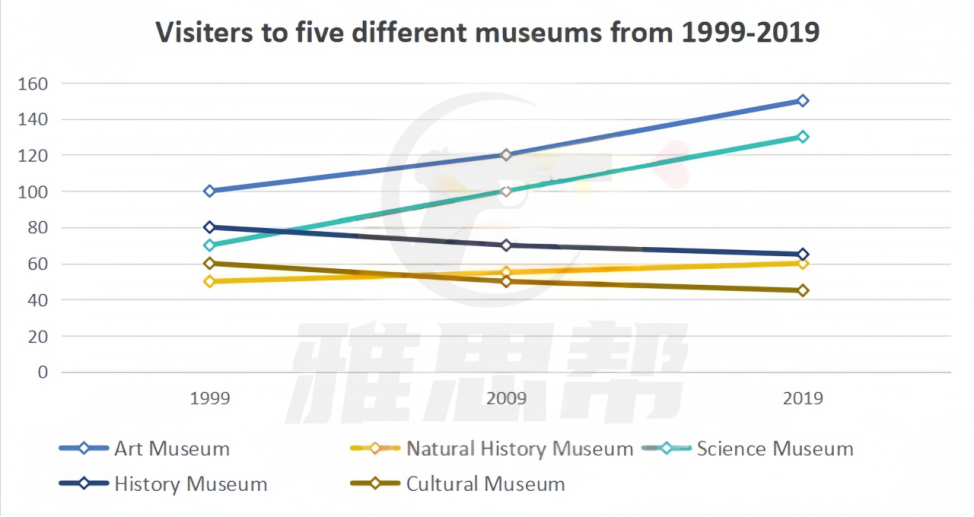
The table below shows the number (thousands) of visitors to five different types of museums in the UK from 1999 to 2019.
Summarise the information by selecting and reporting the main features, and make comparisons where relevant.

题目来源:2025年5月10日大陆雅思小作文
1、题目大意
下表显示了1999年至2019年英国五种不同类型博物馆的游客人数(千人)。
2、高分范文示例
开始段 - 改写题目+总结
The line graph illustrates the changes in the number of visitors to five types of museum in the UK between 1999 and 2019. Overall, the five types of museum showed distinctly different trends over the period. The art museum remained the most visited each year, whereas by 2019, the cultural museum was the least popular. Additionally, attendance at the art and science museums grew substantially, while visitor numbers for the history and cultural museums declined.
第一段 - 描述上升
In 1999, the art museum welcomed around 100,000 visitors, and this figure rose by roughly 50% to about 150,000 in 2019. Similarly, the science museum attracted approximately 70,000 visitors in 1999, and its attendance nearly doubled to around 130,000 by 2019, making it the second most visited museum at that time.
第二段 - 描述下降
In contrast, the history and cultural museums both saw declines in visitor numbers. The history museum's visitors fell from about 80,000 in 1999 to roughly 60,000 in 2019. The cultural museum's visitor numbers also dropped, and from 2009 onwards, it had the lowest figures of all five, at only around 40,000 in 2019. Meanwhile, the natural history museum's visitor numbers grew gradually from nearly 50,000 in 1999 to about 60,000 in 2019, ending at a similar level to the history museum.
必备语料
visitor numbers 参观人数
remained the most visited 一直是最受欢迎的
grew substantially 大幅增长
experienced a decline 出现下降
stood at around 约为
rose by roughly 50% 上升约50%
nearly doubled 几乎翻倍
attracted the fewest visitors 吸引的游客最少
showed distinctly different trends 呈现出明显不同的趋势
ended at a similar level 最终处于相似水平


